Debug a program
Debug your program on Arm or RISC-V hardware through an Ashling probe, or on the RISC-V QEMU simulator. Debug configurations are created and edited from the Ashling Project View, and stored in the project's .vscode/launch.json.
What you need
- Select an SDK for the project. You can't create or start a debug configuration without one.
- Build the project so there is an
.elffile to debug. It appears under the project's Binaries row. - For QEMU: nothing else. The Ashling SDK for RISC-V QEMU needs no probe, drivers or licence.
- For hardware debugging:
- Connect an Ashling Vitra-XS, Opella-XD or Opella-LD probe to the computer and the target, and power the target. VSD boards need an Opella-LD.
- Install the probe drivers (Windows) or udev rules (Linux).
- Activate your licence, unless the SDK is marked No license required.
Create a debug configuration
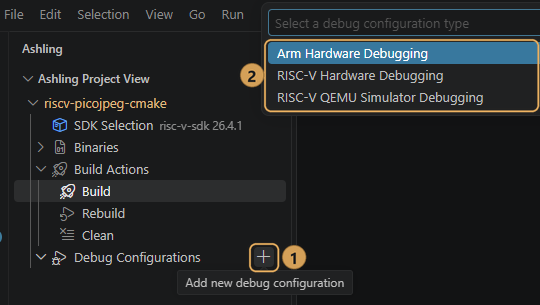
- In the Ashling Project View, expand the project.
- Hover over Debug Configurations and select + (Add new debug configuration) ①.
-
Select the configuration type ② that matches the project's SDK:
Type Use it for SDK Arm Hardware Debugging Arm targets through an Ashling probe Ashling SDK for Arm AArch32 or AArch64 RISC-V Hardware Debugging RISC-V targets through an Ashling probe, including VSD boards (VLSI System Design; no licence needed) Ashling SDK for RISC-V, or Ashling SDK for VSD RISC-V QEMU Simulator Debugging RISC-V programs on the QEMU simulator Ashling SDK for RISC-V QEMU -
Enter a unique name for the configuration, for example
RISC-V launch, and press Enter.
The configuration appears under Debug Configurations, and the Debug Configuration panel opens. To open the panel again later, select the configuration.
The configuration uses the GDB and GDB server from the project's SDK. If the project's root, build/Debug, build or Debug folder already has an .elf file, the first one found is filled in for you.
Picked the wrong type?
The list shows every type, whatever the project's SDK. A configuration whose GDB or GDB server isn't in the SDK can't start. Delete it and add one of the matching type.
The Debug Configuration panel
The panel shows the configuration's type, a Debug button to start debugging, and three tabs: Main, Debugger and Startup.
To save your changes, select Save at the top of the panel, or press Ctrl+S. Save is available only when there are unsaved changes.
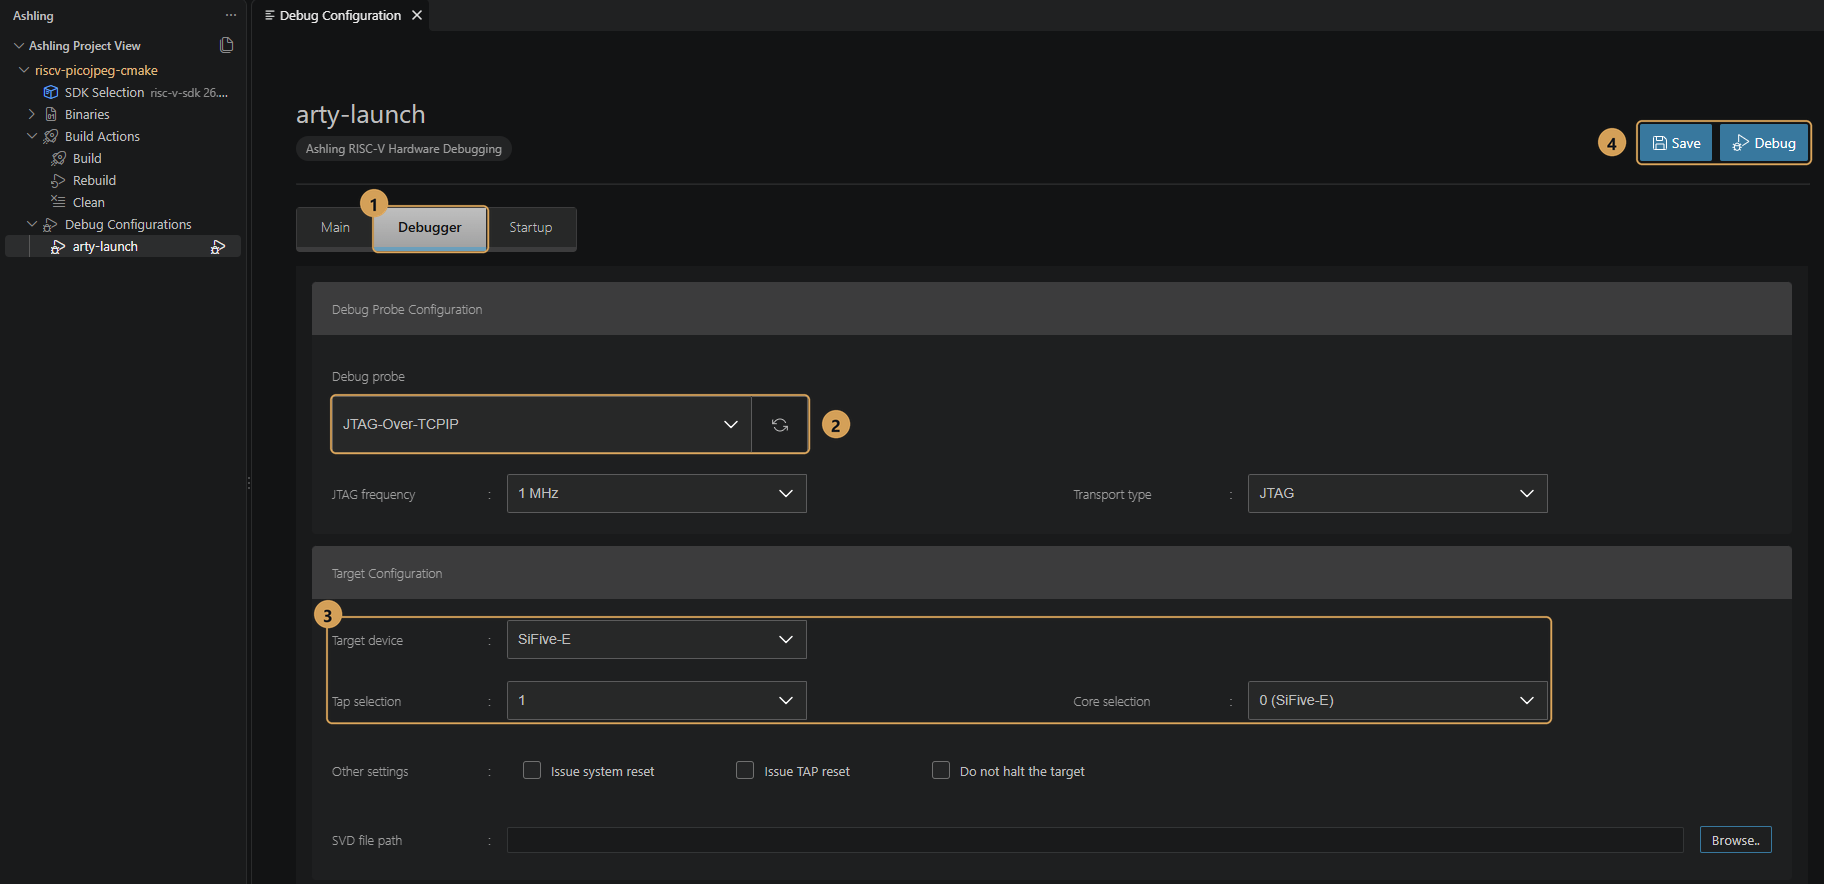
- Select the Debugger tab ①. It holds the probe, target and GDB server settings.
- Pick your Debug probe ②. Select the refresh icon beside it to search for probes again.
- Set the Target device, Tap selection and Core selection ③ for your board:
- Target device: the device on your board, from the list.
- Tap selection and Core selection: on a device with one core, keep the defaults. On a device with several, pick the TAP (the JTAG Test Access Port in front of the core) and the core you want to debug. Your board or device documentation lists them.
- Select Save to keep your changes, or Debug ④ to save and start debugging.
The SDK's defaults are usually enough: QEMU, the board and the GDB come from the Ashling SDK for RISC-V QEMU. Check the C/C++ Application on the Main tab, then select Save, or Debug to save and start debugging. See the QEMU fields in the field reference to change the board or CPU.
Field reference
Each tab of the panel, field by field.
- C/C++ Application
-
The
.elffile to debug.- Search Project.. lists every
.elffile in the project, newest first. Pick the one to debug. - Browse.. lets you choose a file anywhere.
- Search Project.. lists every
Debug Probe Configuration
| Field | Description |
|---|---|
| Debug probe | The connected Ashling probe. A saved probe is shown without scanning; select the refresh icon to search for probes again, for example after connecting a different probe. |
| JTAG frequency | The JTAG clock speed, from 100 MHz down to 0.01 MHz. Lower it if the connection is unreliable. |
| Transport type | How the probe connects to the target: JTAG (the standard four- or five-wire interface), cJTAG (compact two-wire JTAG) or SWD (Arm's two-wire Serial Wire Debug). Pick the one your board uses. |
Target Configuration
| Field | Description |
|---|---|
| Target device | The device on your board. The list comes from the SDK's device database. |
| Tap selection | The JTAG Test Access Port to connect to, on devices with several. |
| Core selection | The core to debug. Lists every core on the selected TAP. |
| Other settings | Issue system reset, Issue TAP reset and Do not halt the target when connecting. |
| SVD file path | The device's SVD (System View Description) file, supplied by the device vendor. The Peripherals view uses it to show the device's peripheral registers. |
GDB Server Setup
| Field | Description |
|---|---|
| Additional arguments | Extra options for the Ashling GDB server, the program that connects GDB to the target through the probe. |
| Server arguments | The full server command line built from the settings above (read only). |
QEMU Setup
| Field | Description |
|---|---|
| Executable path | The QEMU program, for example qemu-system-riscv32. Taken from the SDK by default. |
| Architecture | 32-bit or 64-bit. |
| Board name | The QEMU machine, for example virt. |
| Device name | The CPU model, if the board needs one. |
| More options | Extra QEMU options. The default -S --bios none starts QEMU halted with no BIOS. |
| Do not open graphic windows | Runs QEMU without a graphical window (--nographic). Selected by default. |
GDB Client Setup (both types)
| Field | Description |
|---|---|
| Executable name | The GDB program, for example riscv64-unknown-elf-gdb. Taken from the project's SDK by default. |
| Init commands | GDB commands to run after GDB connects to the target, before the program is loaded. Separate them with commas or new lines. Example: set print pretty on. |
| Field | Description |
|---|---|
| Load Image | Downloads the program to the target. By default it uses the project binary from the Main tab. |
| Load Symbols | Loads debug symbols. By default from the project binary. |
| Set program counter at (hex) | Starts execution from this address instead of the program's entry point. |
| Set break point at | Where the program stops after loading. New configurations stop at main. On QEMU configurations the label is Set breakpoint at. |
| Commands | GDB commands to run after the program is loaded, before execution starts. Prefix commands for the GDB server with monitor. |
Attaching to a running target
On hardware configurations, when Do not halt the target is selected on the Debugger tab, the target keeps running. Load Image and Set break point at are turned off; Load Symbols, Set program counter at (hex) and Commands stay available.
Start debugging
Use any of these:
- Select Debug at the top of the Debug Configuration panel. This saves the configuration first.
- Select the Start Debug Session icon () next to the configuration in the Ashling Project View.
- Open VS Code's Run and Debug view, pick the configuration, and press F5.
When you start from the panel, the status bar shows Launching <configuration name>... while the session starts. By default, the program is loaded and stops at main. To stop somewhere else, click in the gutter next to a line number to set a breakpoint, then select Continue (F5).
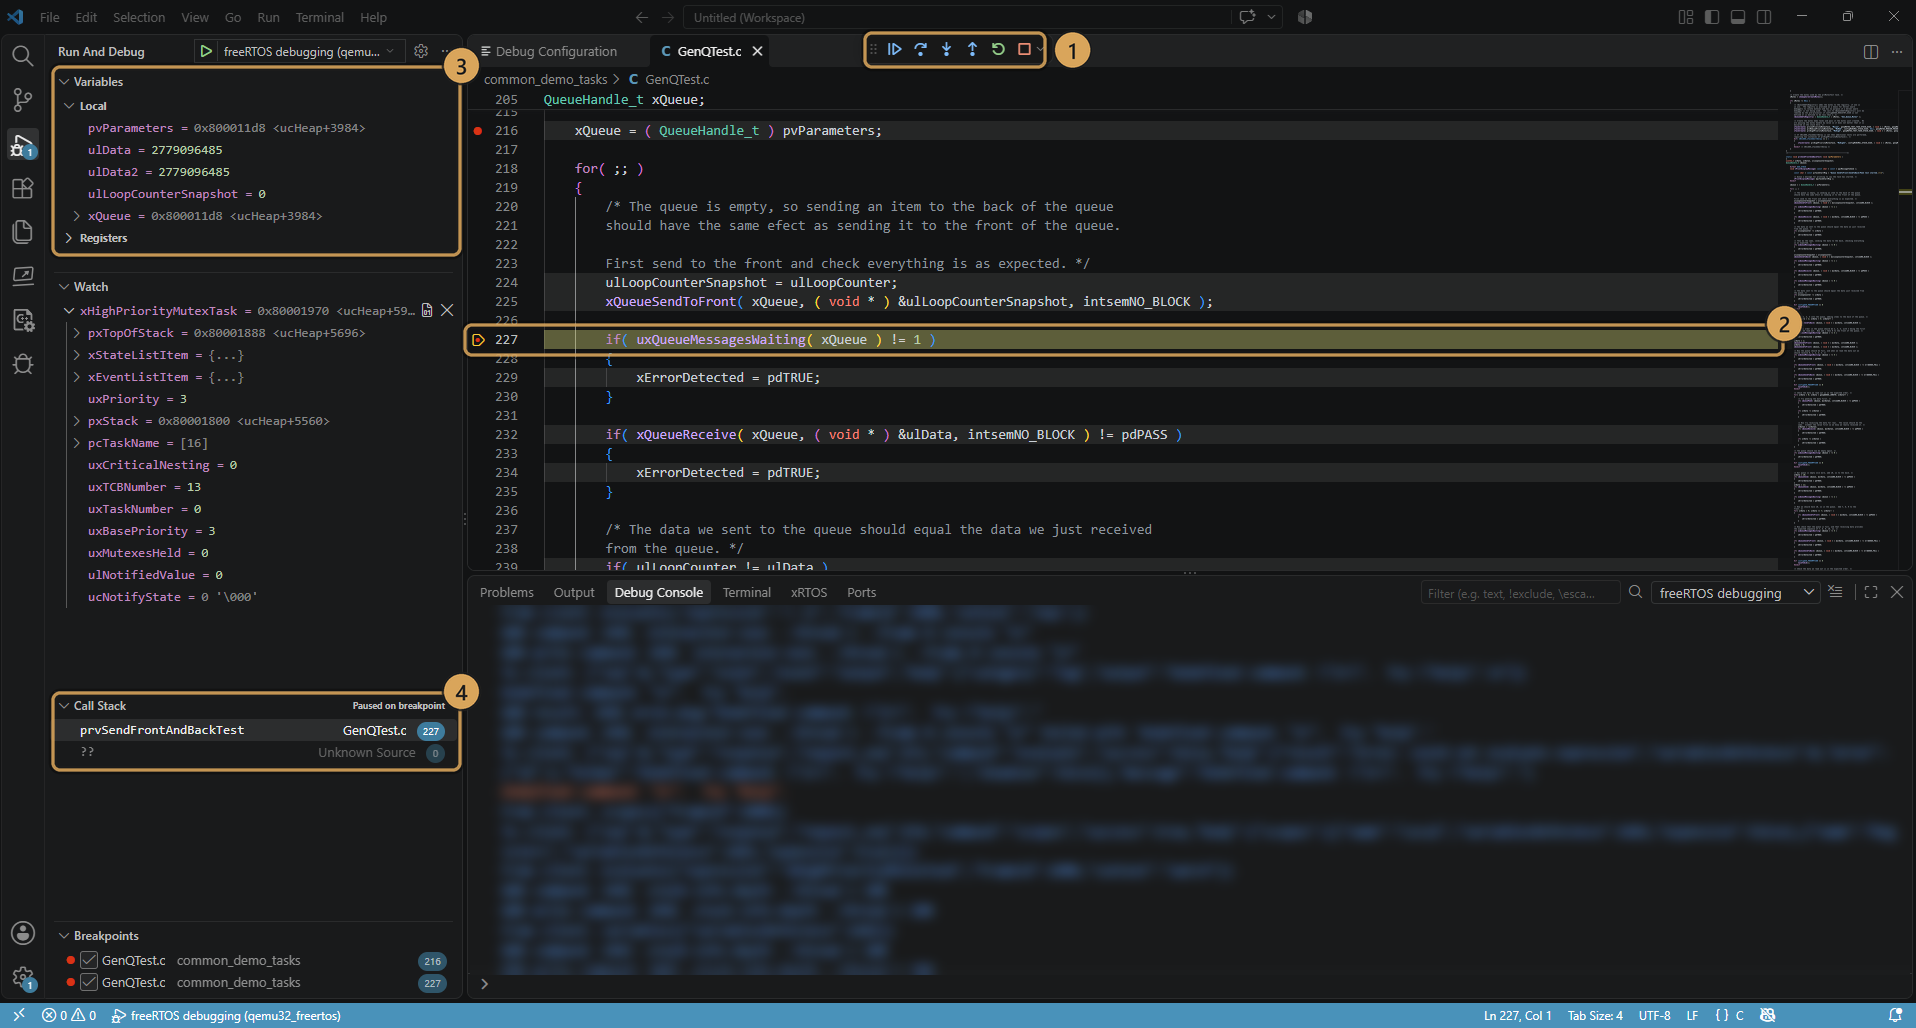
- Control execution with the debug toolbar ①.
- The highlighted line shows where the program is paused ②.
- Inspect local variables and registers in Variables ③.
- Follow the call stack ④.
While debugging
Use the debug toolbar to Continue (F5), Step Over (F10), Step Into (F11), Step Out (Shift+F11), Restart and Stop. Click in the gutter next to a line number to set a breakpoint.
| View | How to open it |
|---|---|
| Variables, Registers, Watch, Call Stack, Breakpoints | The Run and Debug view (Ctrl+Shift+D) |
| Debug Console | The Debug Console tab in the panel. GDB server and QEMU output appears here, and you can type GDB commands. |
| Memory | Run GDB: Open Memory Browser from the Command Palette. See View memory. |
| Disassembly | Right-click a frame in the Call Stack and select Open Disassembly View. See View disassembly. |
| Peripheral registers | The Peripherals section of the Run and Debug view. It appears once the SVD file path is set on the Debugger tab. From the Peripheral Inspector extension. |
| RTOS tasks | The xRTOS tab in the panel, for FreeRTOS, Zephyr and µC/OS-II applications. From the RTOS Views extension. |
View memory
Use the Memory Browser to read the target's memory while the program is paused.
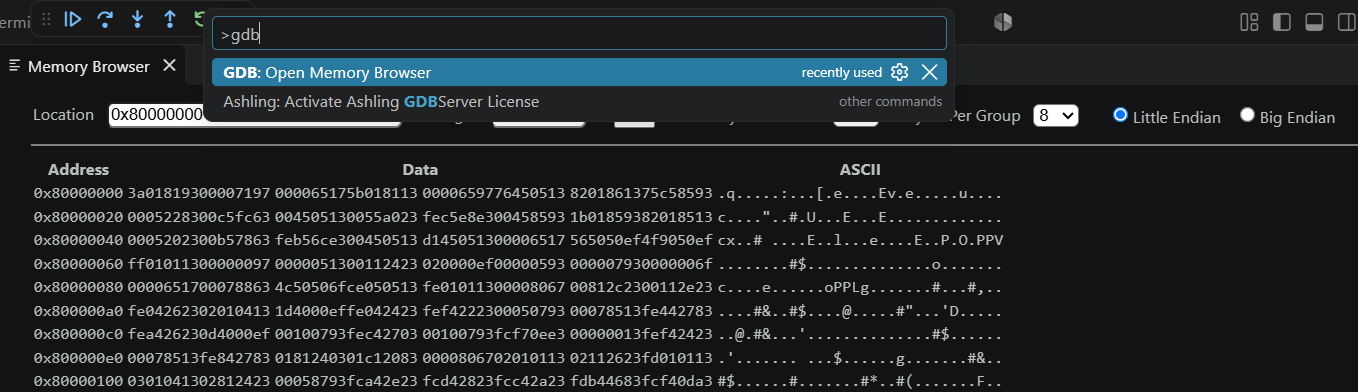
- Start a debug session and pause it, for example at a breakpoint.
- Open the Command Palette (Ctrl+Shift+P), type
gdb, and select GDB: Open Memory Browser. The Memory Browser opens in an editor tab. - In Location, enter an address such as
0x80000000, or an expression that gives an address, such as&buffer. - In Length, enter how many bytes to read, in decimal or hex. The default is 512.
- Select Go.
Each row starts with its Address, followed by the bytes in hex under Data and as text under ASCII. To change the layout, pick Bytes Per Row and Bytes Per Group, and choose Little Endian or Big Endian to match your target.
The Memory Browser reads memory when you select Go. After you step or continue, select Go again to see the latest values.
View disassembly
The Disassembly view shows the machine instructions around where the program is paused, with the source lines they come from.
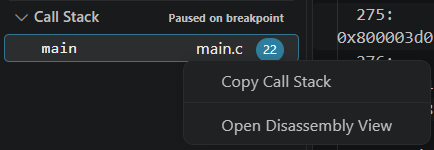
- While the program is paused, right-click a frame in the Call Stack, for example
main, and select Open Disassembly View. You can also right-click in the source editor and select Open Disassembly View, or run Open Disassembly View from the Command Palette (typedisassembly). - The Disassembly tab opens next to your source files.
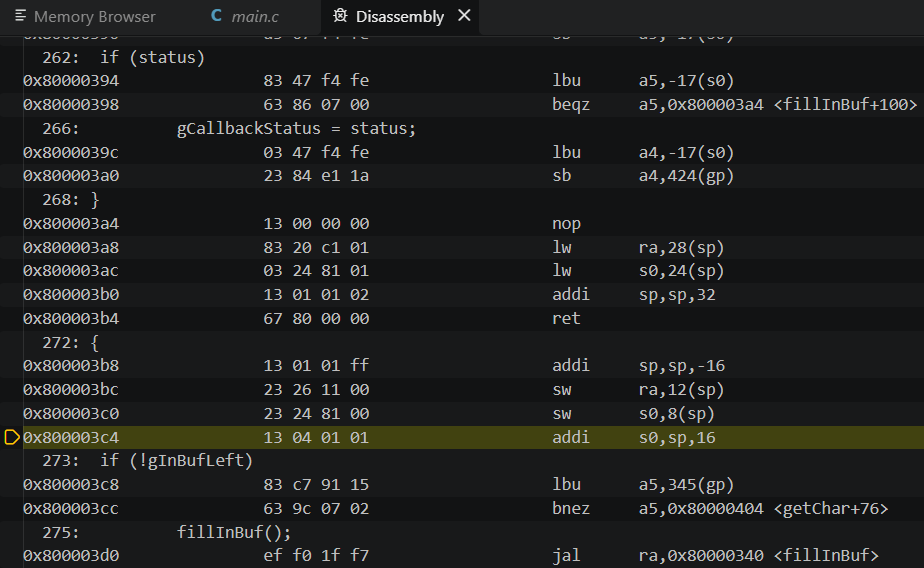
Each row shows an instruction's address, its bytes and the instruction itself. Source lines appear, with their line numbers, above the instructions they compile to. The highlighted row, marked with an arrow in the margin, is the instruction the program is paused at.
Debug several cores
You can debug several cores of one device at the same time, including cores of different types, each in its own debug session:
- Create one debug configuration per core, with the matching configuration type, and set its Tap selection and Core selection on the Debugger tab.
- Start each configuration. Each session appears in the Call Stack view; select a session to control its core.
Each hardware configuration starts its own Ashling GDB server, on a port chosen when the configuration was created, so you don't need to change ports. All QEMU configurations use the same GDB port (1234), so run only one QEMU session at a time.
Edit or delete a configuration
- Edit: select the configuration in the Ashling Project View to open its panel, change it, and select Save or press Ctrl+S.
- Delete: right-click the configuration and select Delete configuration, then Yes.
Configurations are ordinary entries in .vscode/launch.json, so you can also edit that file directly.
Common debug problems
No SDK is selected for project. Select an SDK for this project to debug it.
Select an SDK for the project, then try again. Select Select SDK in the message to do it straight away.
No debug probes found
The Debug probe list shows No debug probes found when the scan finds no probe. Check the probe's USB connection, then the drivers on Windows or the udev rules on Linux, and select the refresh icon next to Debug probe.
No .elf files found in project. Build the project first.
Build the project, then select Search Project.. again.
tool (the \"gdb\" or \"server\" of configuration) is not in the SDK sdk version of project
For example: riscv64-unknown-elf-gdb (the "gdb" of "RISC-V launch") is not in the SDK arm-32-sdk 26.4.1 of my-project. The project's SDK doesn't include the GDB or GDB server this configuration needs, typically after switching a RISC-V project to an Arm SDK. Select the right SDK, or create a new configuration of the matching type.
The target doesn't respond
Check, in this order:
- The target is powered, and the probe's cable is firmly connected to the right header.
- Target device, Tap selection and Core selection match your board.
- Transport type matches how the board is wired (JTAG, cJTAG or SWD).
- Lower the JTAG frequency.
- Try Issue system reset or Issue TAP reset under Other settings.
For more help, see Troubleshooting.