Quick start
This page takes you from a fresh install to a running debug session using an example project from an Ashling SDK. Each step links to a page with more detail. Where a screenshot has numbered markers, the numbers in the list below it match them.
What you need
- Visual Studio Code 1.82 or later, on Windows 10/11 x64 or Linux x64. If you don't have it yet, download Visual Studio Code and install it. To check the version you have, select Help → About.
- An internet connection, to install SDKs.
- For hardware debugging, an Ashling Vitra-XS, Opella-XD or Opella-LD probe and a target board. VSD boards need an Opella-LD.
- For hardware debugging, an Ashling licence key, except on VSD boards. To get one, contact support@ashling.com.
No hardware yet?
Install Ashling SDK for RISC-V QEMU in step 2. Its examples run on the QEMU simulator, so you don't need a probe or a licence, and you can skip step 3.
1. Install the extension
In VS Code, open the Extensions view (Ctrl+Shift+X), search for RiscFree, and select Install on RiscFree™ for Embedded Software Development (publisher Ashling).
When the install finishes, the Ashling icon ( ) appears in the Activity Bar.
Guided walkthrough in VS Code
Once the extension is installed, it adds a walkthrough to the VS Code Welcome page: Get Started with RiscFree™ for Embedded Software Development. It covers the same steps as this page, from opening the Ashling view to your first debug session. Buttons such as Open SDK Manager, Import Example Project and Activate License run a step for you, and each step is ticked off when you do it.
To open it, select Help → Welcome, then the walkthrough under Walkthroughs. You can also run Welcome: Open Walkthrough… from the Command Palette (Ctrl+Shift+P).
2. Install an SDK
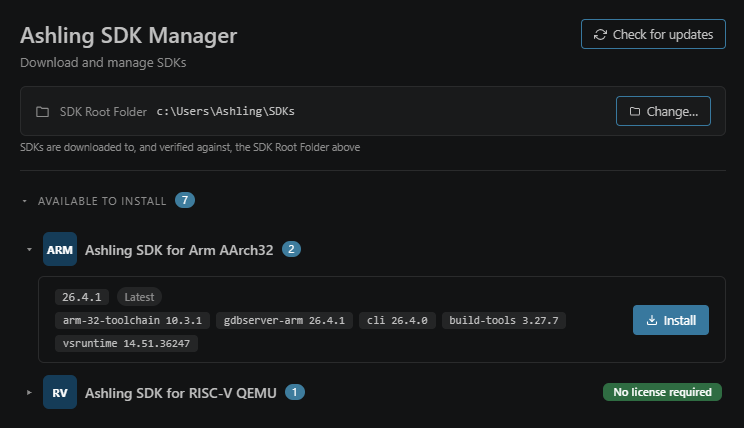
Select the Ashling icon in the Activity Bar, then under Quick Settings select SDK Manager.
- Select Check for updates at the top right to get the latest list of SDKs.
- Under Available to install, expand the SDK for your target (see Supported SDKs). Each version is tagged Latest or Previous and lists the components it contains.
- Select Install next to the version tagged Latest.
- When the install finishes, the SDK moves to Installed. A verified tag means every component passed its check.
SDKs are installed in the SDK Root Folder shown at the top. You only need to change it to put SDKs on another drive; see Change the SDK root folder.
For hardware debugging, set up the probe once: on Windows you are asked to install any missing probe drivers when the SDK install finishes; on Linux, install the udev rules.
3. Activate your licence
Skip this step for SDKs marked No license required.
- Under Quick Operations, select Activate Ashling GDB Server License.
- Pick the SDK. The License Activation window opens.
- Enter your licence key and select Activate.
No key yet? Contact support@ashling.com. VS Code itself shows no message after you activate; activation happens in the separate License Activation window.
4. Import an example project
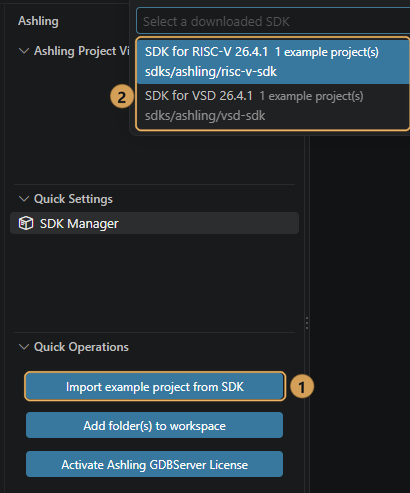
- Under Quick Operations, select Import example project from SDK ①.
- Pick the SDK ②, then pick an example.
- Choose a parent folder and select Import '<example name>' here. The example is created in a new subfolder named after it.
The project opens in the Ashling Project View, and the SDK it came from is selected for it automatically.
5. Build
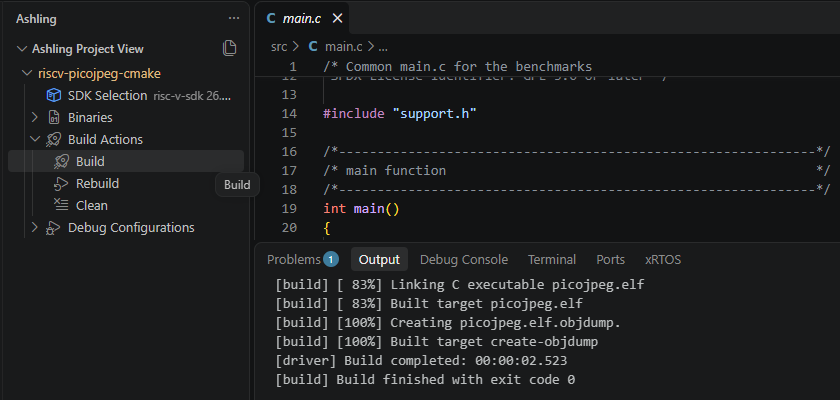
- In the Ashling Project View, expand your project, then Build Actions, and select Build.
- The build output appears in the Output panel. A successful build ends with Build finished with exit code 0.
6. Create a debug configuration
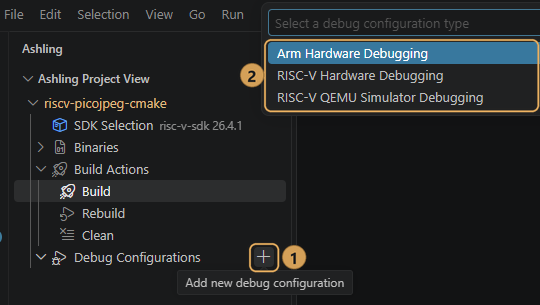
- Hover over Debug Configurations and select + (Add new debug configuration) ①.
- Pick the configuration type ② that matches your SDK: RISC-V QEMU Simulator Debugging for the QEMU SDK, or RISC-V Hardware Debugging or Arm Hardware Debugging for hardware.
- Enter a name. The Debug Configuration panel opens.
- Set up the target:
- QEMU: keep the defaults from the SDK.
- Hardware: on the Debugger tab, select your Debug probe and the Target device on your board. See The Debug Configuration panel for the other target settings.
- Select Save.
More about debug configurations
7. Start debugging
Select Debug at the top of the Debug Configuration panel, or the Start Debug Session icon () next to the configuration in the Ashling Project View. When you start from the panel, the status bar shows Launching <configuration name>... while the session starts. By default, the program is loaded and stops at main.
To stop somewhere else, click in the gutter next to a line number to set a breakpoint, then select Continue (F5). The screenshot shows a FreeRTOS example on QEMU stopped at a breakpoint set this way.
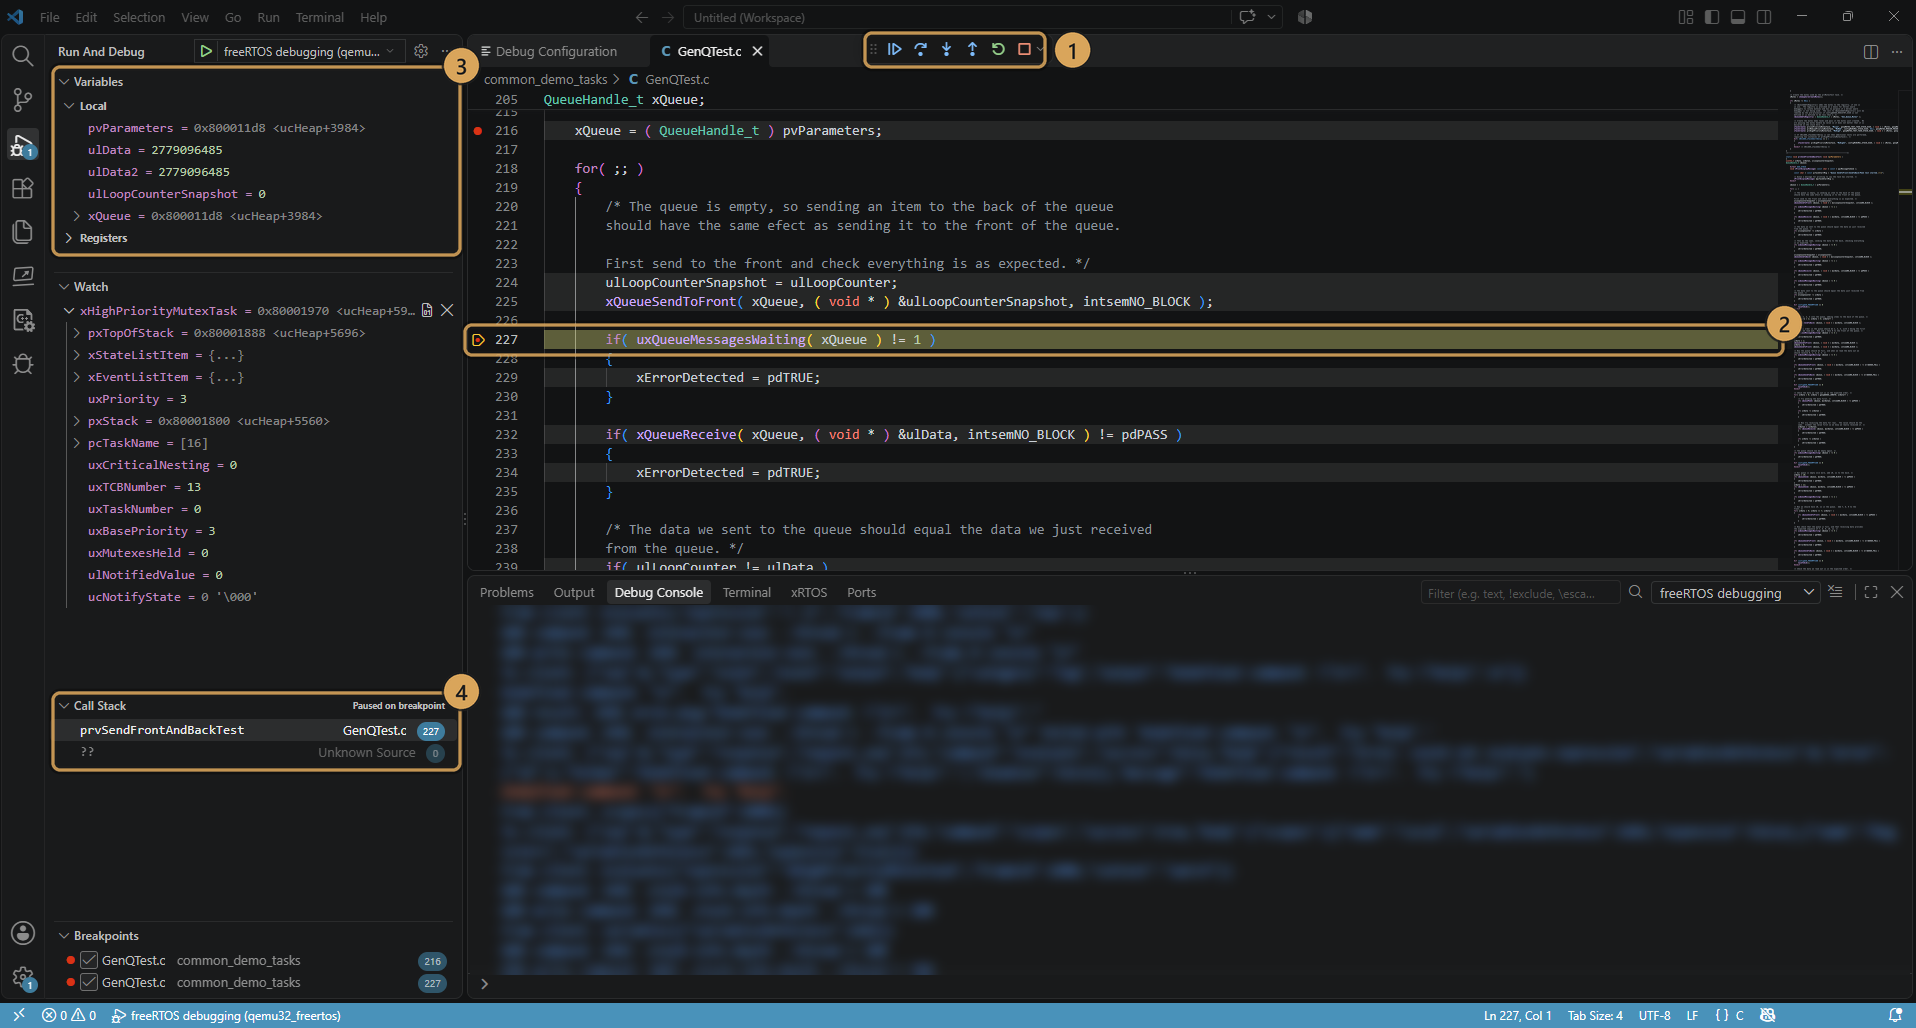
- Control execution with the debug toolbar ①.
- The highlighted line shows where the program is paused ②.
- Inspect variables and registers ③.
- Follow the call stack ④.
Next steps
- Select an SDK for your own project — open an existing CMake or Make project and pick the SDK it builds with.
- Debug configuration reference — every field on the Main, Debugger and Startup tabs.
- Probe drivers — set up Vitra-XS and Opella probes on Windows and Linux.
- Troubleshooting — logs and fixes for common messages.